Datoteka:Recent Sea Level Rise.png

Izvor: Wikipedija
Prijeđi na navigaciju Prijeđi na pretragu

Recent_Sea_Level_Rise.png(537 × 373 piksela, veličina datoteke/fajla: 47 kB, MIME tip: image/png)

Ova datoteka je s projekta Vikimedijina ostava i može se upotrebljavati i na drugim projektima. Ispod su prikazane informacije s njene opisne stranice.

Opis izmjene

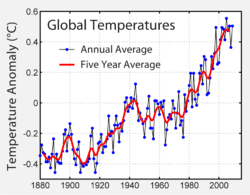
Temperature changes during a similar period and possibly responsible for causing the observed sea level rise.
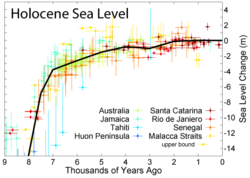
Sea level variations over the last nine thousand years

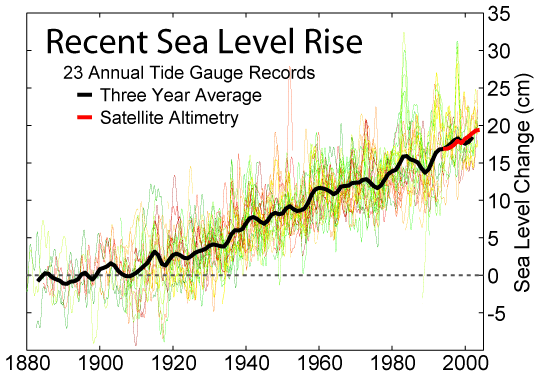
This figure shows the change in annually averaged sea level at 23 geologically stable tide gauge sites with long-term records as selected by Douglas (1997). The thick dark line is a three-year moving average of the instrumental records. These data indicate a sea level rise of ~27.5 cm from 1800-2000. Because of the limited geographic coverage of these records, it is not obvious whether the apparent decadal fluctuations represent true variations in global sea level or merely variations across regions that are not resolved.

For comparison, the recent annually averaged satellite altimetry data [1] from TOPEX/Poseidon are shown in red. These data indicate a somewhat higher rate of increase than tide gauge data, however the source of this discrepancy is not obvious. It may represent systematic error in the satellite record and/or incomplete geographic sampling in the tide gauge record. The month to month scatter on the satellite measurements is roughly the thickness of the plotted red curve.

Data

Original data for this figure are from the Permanent Service for Mean Sea Level [2] archive copy at the Wayback Machine (PSMSL). Douglas (1997), defined the following criteria for selecting records from the PSMSL which were long, reliable, and avoided large vertical geologic changes:

  1. Each record should be at least 60 years in length
  2. Not be located at collisional plate boundaries
  3. At least 80% complete
  4. Show reasonable agreement at low frequencies with nearby gauges sampling the same water mass
  5. Not be located in regions subject to large post-glacial rebound

He subsequently identified 24 PSMSL records meeting all five of these criteria:

  1. Auckland, 1903-2000
  2. Balboa, 1908-1996
  3. Brest, 1807-2000
  4. Buenos Aires, Argentina, 1905-1987
  5. Cascais, 1882-1993
  6. Cristobal, 1909-1980
  7. Dunedin, 1900-1998
  8. Fernandina, 1897-2003
  9. Genova, 1884-1997
  10. Honolulu, 1905-2003
  11. Key West, 1913-2003
  12. Lagos, 1908-1999
  13. La Jolla, 1924-2003
  14. Lyttelton, 1924-2000
  15. Marseille, 1885-2000
  16. Newlyn, Cornwall, 1915-2003
  17. Pensacola, 1923-2003
  18. Quequen, 1918-1982
  19. San Diego, 1906-2003
  20. San Francisco, 1854-2003
  21. Santa Cruz de Tenerife, 1927-1990
  22. Santa Monica, 1933-2003
  23. Trieste, 1905-2001
  24. Wellington, 1901-1988

After slight corrections following Douglas (1997) for any remaining post-glacial rebound at these sites (typically ~3 cm/century), the tide gauge data from these sites were plotted in no particular order as the thin lines in the above figure. One site, Wellington, was omitted because the author of this figure was unable to locate the corresponding record from the PSMSL.

Copyright

This figure was prepared from publicly available data by Robert A. Rohde and is incorporated into the Global Warming Art project.

Image from Global Warming Art
This image is an original work created for Global Warming Art. Please refer to the image description page for more information.
GNU head Dopušteno je umnožavanje, dijeljenje i mijenjanje ovog dokumenta pod uslovima GNU-ove licence za slobodnu dokumentaciju, verzije 1.2 ili bilo koje novije koju objavi Fondacija za slobodni softver; bez nepromjenljivih odjeljaka i bez tekstova na naslovnoj i zadnjoj strani. Tekst licence možete pročitati ovdje.
w:bs:Creative Commons
pripisivanje dijeljenje pod istim uslovima
Ova datoteka dostupna je pod licencom Creative Commons Attribution-Share Alike 3.0 Unported licencom.
Slobodno smijete:
  • dijeliti – umnožavati, raspodjeljivati i prenositi djelo
  • prerađivati – prilagođavati djelo
Pod sljedećim uslovima:
  • pripisivanje – Morate pripisati odgovarajuće autorske zasluge, osigurati link ka licenci i naznačiti jesu li napravljene izmjene. To možete uraditi na bilo koji razumni način, ali ne tako da se sugerira da davalac licence odobrava Vas ili Vašu upotrebu njegovog djela.
  • dijeljenje pod istim uslovima – Ako mijenjate, transformišete ili nadograđujete ovaj materijal, morate ga objaviti i distribuirati samo pod istom ili sličnom licencom poput ove.
Ova oznaka licence je dodana na ovu datoteku kao dio GFDL ažuriranja licence.


Reference

Bruce C. Douglas (1997). "Global Sea Rise: A Redetermination". Surveys in Geophysics 18: 279–292. DOI:10.1023/A:1006544227856.


This geology image could be re-created using vector graphics as an SVG file. This has several advantages; see Commons:Media for cleanup for more information. If an SVG form of this image is available, please upload it and afterwards replace this template with {{vector version available|new image name}}.


It is recommended to name the SVG file “Recent Sea Level Rise.svg”—then the template Vector version available (or Vva) does not need the new image name parameter.

Opisi

Dodajte objašnjenje u jednom redu što predstavlja ova datoteka

Predmeti pokazani na ovoj datoteci

prikazuje

vrsta medija na Internetu Serbian (Latin script)

image/png

Historija datoteke

Kliknite na datum/vrijeme da biste vidjeli tadašnju verziju datoteke.

Datum/vrijemeMinijaturaDimenzijeKorisnikKomentar
aktualna16:49, 26 decembar 2005Minijatura verzije (16:49, 26 decembar 2005)537 × 373 (47 kB)AngrenseRecent changes in seal level. Source:English version of Wikipedia.

Sljedeća stranica koristi ovu datoteku:

Globalna upotreba datoteke

Ovu datoteku upotrebljavaju i sljedeći projekti:

Potpunija globalna upotreba datoteke

Metapodaci