Datoteka:DT fusion rxnrate.svg
Prijeđi na navigaciju
Prijeđi na pretragu

Veličina ovog PNG-pregleda ove SVG-datoteke: 360 × 324 piksela. Druge rezolucije: 267 × 240 piksela | 533 × 480 piksela | 853 × 768 piksela | 1.138 × 1.024 piksela | 2.276 × 2.048 piksela.
Izvorna datoteka (SVG fajl, nominalno 360 × 324 piksela, veličina fajla: 12 kB)
Opis izmjene
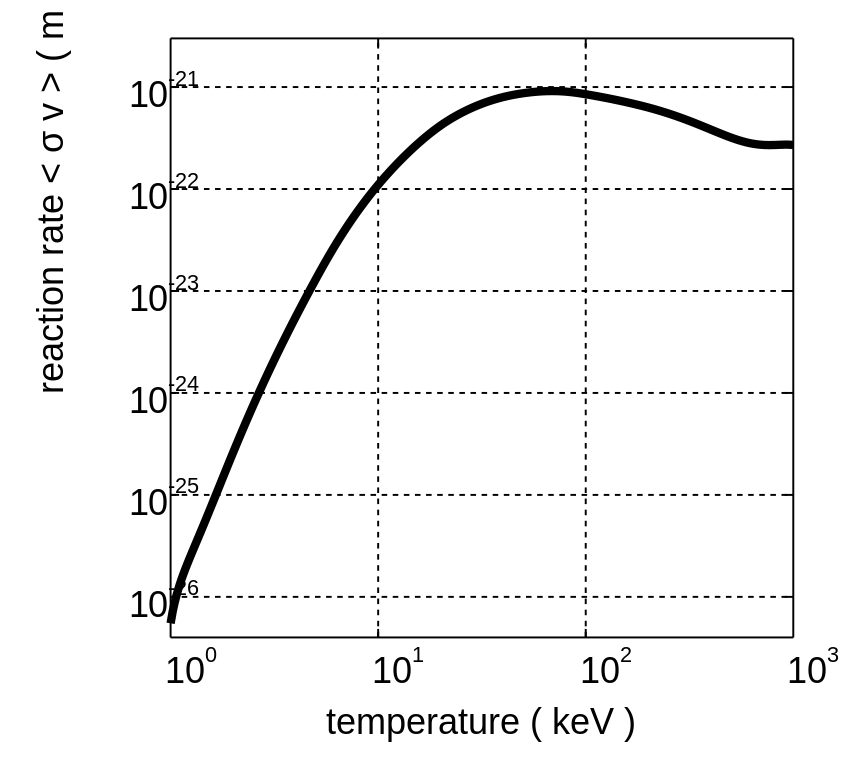
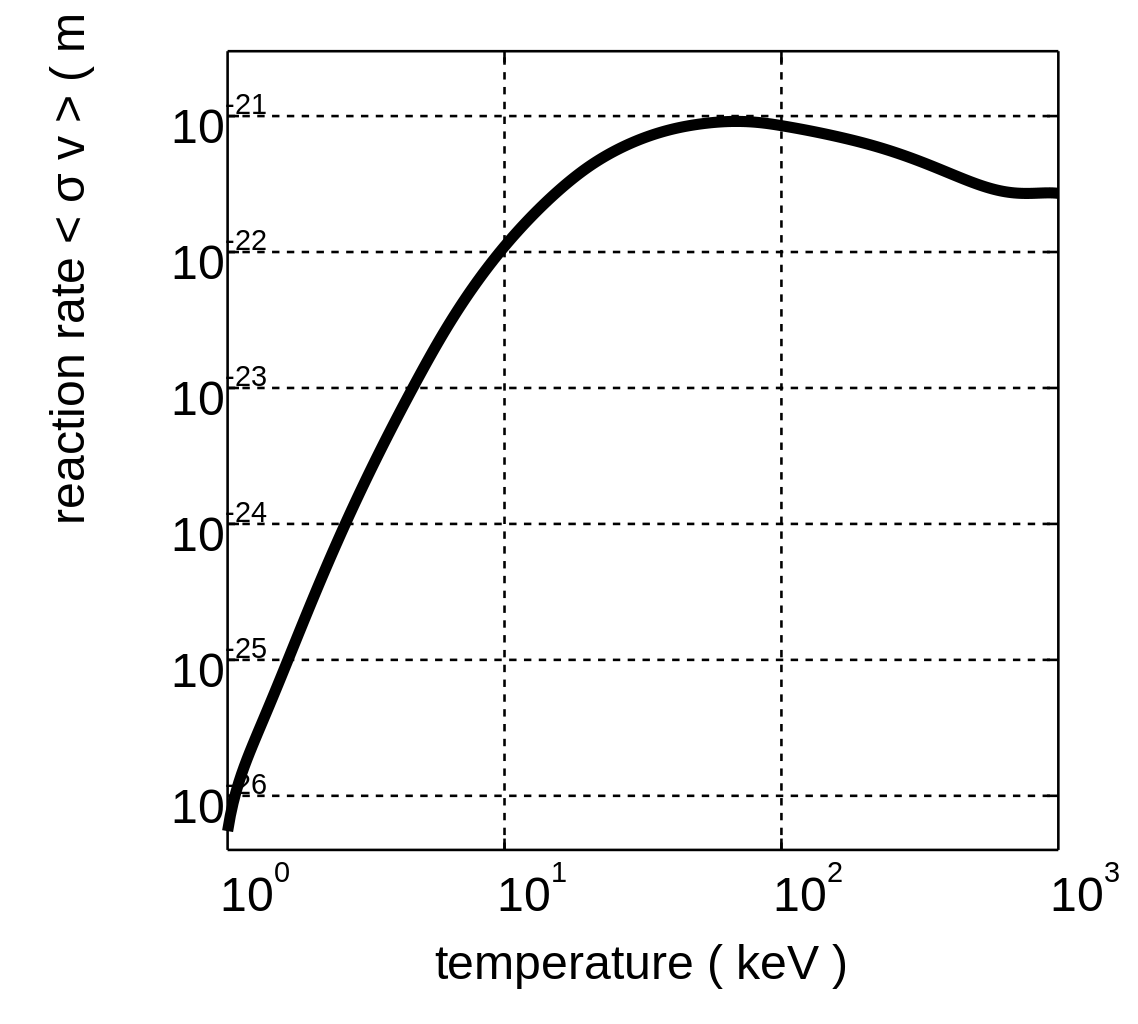
Logarithmic plot of the deuteron-triton fusion reaction rate <σv>, for Maxwellian ion velocity distributions with the same temperature. Created on 10 December 2005 by David Strozzi using Matlab. The curve is a spline interpolation through the data points included on p. 45 of the 2000 revision of the "NRL Plasma Formulary."
Licenciranje
Ova datoteka je licencirana pod Creative Commons Attribution-Share Alike 2.5 generičkom licencom.
- Slobodno smijete:
- dijeliti – umnožavati, raspodjeljivati i prenositi djelo
- prerađivati – prilagođavati djelo
- Pod sljedećim uslovima:
- pripisivanje – Morate pripisati odgovarajuće autorske zasluge, osigurati link ka licenci i naznačiti jesu li napravljene izmjene. To možete uraditi na bilo koji razumni način, ali ne tako da se sugerira da davalac licence odobrava Vas ili Vašu upotrebu njegovog djela.
- dijeljenje pod istim uslovima – Ako mijenjate, transformišete ili nadograđujete ovaj materijal, morate ga objaviti i distribuirati samo pod istom ili sličnom licencom poput ove.
Historija datoteke
Kliknite na datum/vrijeme da biste vidjeli tadašnju verziju datoteke.
| Datum/vrijeme | Minijatura | Dimenzije | Korisnik | Komentar | |
|---|---|---|---|---|---|
| aktualna | 02:15, 12 decembar 2005 | | 360 × 324 (12 kB) | Dstrozzi~commonswiki | Logarithmic plot of the deuteron-triton fusion reaction rate <σv>, for Maxwellian ion velocity distributions with the same temperature. Created on 11 December 2005 by David Strozzi using Matlab. The curve is a spline interpolation through the data |
| 00:01, 11 decembar 2005 |  | 270 × 234 (12 kB) | Dstrozzi~commonswiki | Logarithmic plot of the deuteron-triton fusion reaction rate <σv>, for Maxwellian ion velocity distributions with the same temperature. Created on 10 December 2005 by David Strozzi using Matlab. The curve is a spline interpolation through the data | |
| 22:19, 10 decembar 2005 | 270 × 3 (12 kB) | Dstrozzi~commonswiki | Logarithmic plot of the deuteron-triton fusion reaction rate <σv>, for Maxwellian ion velocity distributions with the same temperature. Created on 10 December 2005 by David Strozzi using Matlab. The curve is a spline interpolation through the data | ||
| 21:52, 10 decembar 2005 | 270 × 3 (12 kB) | Dstrozzi~commonswiki | Logarithmic plot of the deuteron-triton fusion reaction rate <σv>, for Maxwellian ion velocity distributions with the same temperature. Created on 10 December 2005 by David Strozzi using Matlab. The curve is a spline interpolation through the data | ||
| 09:24, 10 decembar 2005 |  | 512 × 333 (12 kB) | Dstrozzi~commonswiki | Logarithmic plot of the deuteron-triton fusion reaction rate <v>, for Maxwellian ion velocity distributions with the same temperature. Created on 9 December 2005 by David Strozzi using Matlab. The curve is a spline interpolation through the data points i |
Upotreba datoteke
Sljedeća stranica koristi ovu datoteku:
Globalna upotreba datoteke
Ovu datoteku upotrebljavaju i sljedeći projekti:
- Upotreba na projektu bs.wikipedia.org
- Upotreba na projektu eo.wikipedia.org
- Upotreba na projektu es.wikipedia.org
- Upotreba na projektu fr.wikibooks.org
- Upotreba na projektu hr.wikipedia.org
- Upotreba na projektu ko.wikipedia.org
- Upotreba na projektu no.wikipedia.org
- Upotreba na projektu pt.wikipedia.org
- Upotreba na projektu sr.wikipedia.org