Datoteka:65 Myr Climate Change.png

Izvor: Wikipedija
Prijeđi na navigaciju Prijeđi na pretragu

65_Myr_Climate_Change.png(650 × 397 piksela, veličina datoteke/fajla: 21 kB, MIME tip: image/png)

Ova datoteka je s projekta Vikimedijina ostava i može se upotrebljavati i na drugim projektima. Ispod su prikazane informacije s njene opisne stranice.

Opis izmjene

Opis
English:
Expanded view of climate change during the last five million years, showing the rapid oscillations in the glacial state.
View of climate change extending back through the last 540 million years, including many cycles of change from warm to cold and back again.

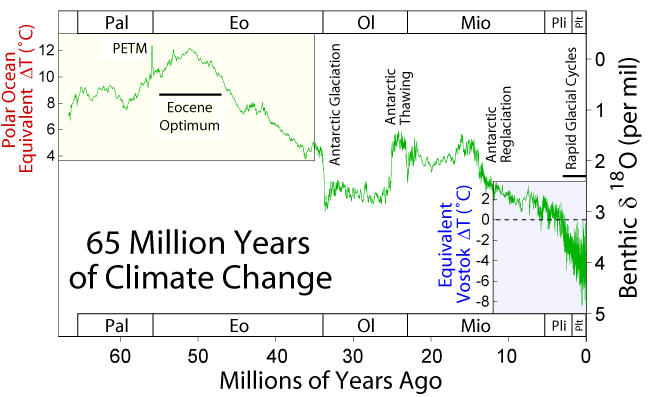
This figure shows climate change over the last 65 million years. The data are based on a compilation of oxygen isotope measurements (δ18O) on benthic foraminifera by Zachos et al. (2001) which reflect a combination of local temperature changes in their environment and changes in the isotopic composition of sea water associated with the growth and retreat of continental ice sheets.

Because it is related to both factors, it is not possible to uniquely tie these measurements to temperature without additional constraints. For the most recent data, an approximate relationship to temperature can be made by observing that the oxygen isotope measurements of Lisiecki and Raymo (2005) are tightly correlated to temperature changes at Vostok as established by Petit et al. (1999). Present day is indicated as 0. For the oldest part of the record, when temperatures were much warmer than today, it is possible to estimate temperature changes in the polar oceans (where these measurements were made) based on the observation that no significant ice sheets existed and hence all fluctuation in (δ18O) must result from local temperature changes (as reported by Zachos et al.).

The intermediate portion of the record is dominated by large fluctuations in the mass of the Antarctic ice sheet, which first nucleates approximately 34 million years ago, then partially dissipates around 25 million years ago, before re-expanding towards its present state 13 million years ago. These fluctuations make it impossible to constrain temperature changes without additional controls.

Significant growth of ice sheets did not begin in Greenland and North America until approximately 3 million years ago, following the formation of the Isthmus of Panama by continental drift. This ushered in an era of rapidly cycling glacials and interglacials (see figure at upper right).

Also appearing on this graph are the Eocene Climatic Optimum, an extended period of very warm temperatures, and the Paleocene-Eocene Thermal Maximum (labeled PETM). The PETM is very short lived high temperature excursion possibly associated with the destablization of methane clathrates and the rapid buildup of greenhouse gases in the atmosphere. Due to the coarse sampling and averaging involved in this record, it is likely that the full magnitude of the PETM is underestimated by a factor of 2-4 times its apparent height.
Datum 17 December 2005
Izvor Vlastito djelo
Autor Robert A. Rohde
Dopuštenje
(Ponovna upotreba ove datoteke)
This figure was prepared by Robert A. Rohde from published and publicly available data and is incorporated into the Global Warming Art project.

Licenciranje

Image from Global Warming Art
This image is an original work created for Global Warming Art. Please refer to the image description page for more information.
GNU head Dopušteno je umnožavanje, dijeljenje i mijenjanje ovog dokumenta pod uslovima GNU-ove licence za slobodnu dokumentaciju, verzije 1.2 ili bilo koje novije koju objavi Fondacija za slobodni softver; bez nepromjenljivih odjeljaka i bez tekstova na naslovnoj i zadnjoj strani. Tekst licence možete pročitati ovdje.
w:bs:Creative Commons
pripisivanje dijeljenje pod istim uslovima
Ova datoteka dostupna je pod licencom Creative Commons Attribution-Share Alike 3.0 Unported licencom.
Slobodno smijete:
  • dijeliti – umnožavati, raspodjeljivati i prenositi djelo
  • prerađivati – prilagođavati djelo
Pod sljedećim uslovima:
  • pripisivanje – Morate pripisati odgovarajuće autorske zasluge, osigurati link ka licenci i naznačiti jesu li napravljene izmjene. To možete uraditi na bilo koji razumni način, ali ne tako da se sugerira da davalac licence odobrava Vas ili Vašu upotrebu njegovog djela.
  • dijeljenje pod istim uslovima – Ako mijenjate, transformišete ili nadograđujete ovaj materijal, morate ga objaviti i distribuirati samo pod istom ili sličnom licencom poput ove.
Ova oznaka licence je dodana na ovu datoteku kao dio GFDL ažuriranja licence.


Notes

  • The data is plotted as a 10 point average of the original data to minimize measurement noise.
  • The absolute calibration of the early part of the record relative to modern-day is somewhat uncertain, so that the entire scale may need to be shifted ± a few degrees for a true comparison to present.
  • The labels on the top and bottom of the figure are abbreviations for different geologic epochs of the geologic time scale.
  • The data shown is very useful, when observing a long period of time.

References

  • Lisiecki, L. E., and M. E. Raymo (2005). "A Pliocene-Pleistocene stack of 57 globally distributed benthic δ18O records" (PDF). Paleoceanography 20: 1003. doi:10.1029/2004PA001071.[dead link]
  • Petit J.R., Jouzel J., Raynaud D., Barkov N.I., Barnola J.M., Basile I., Bender M., Chappellaz J., Davis J., Delaygue G., Delmotte M., Kotlyakov V.M., Legrand M., Lipenkov V., Lorius C., Pépin L., Ritz C., Saltzman E., Stievenard M. (1999). "Climate and Atmospheric History of the Past 420,000 years from the Vostok Ice Core, Antarctica". Nature 399: 429–436.
  • Zachos, James, Mark Pagani, Lisa Sloan, Ellen Thomas, and Katharina Billups (2001). "Trends, Rhythms, and Aberrations in Global Climate 65 Ma to Present". Science 292 (5517): 686–693. doi:10.1126/science.1059412.

derivative works

Derivative works of this file:

Opisi

Dodajte objašnjenje u jednom redu što predstavlja ova datoteka

Predmeti pokazani na ovoj datoteci

prikazuje

17 decembar 2005

vrsta medija na Internetu Serbian (Latin script)

image/png

kontrolna suma Srpski (transliteracija)

fde0e20cdda21a80377578d80f730e3bed593b68

veličina podatka Srpski (transliteracija)

21.498 Bajt

397 piksel

650 piksel

Historija datoteke

Kliknite na datum/vrijeme da biste vidjeli tadašnju verziju datoteke.

Datum/vrijemeMinijaturaDimenzijeKorisnikKomentar
aktualna15:15, 18 juli 2010Minijatura verzije (15:15, 18 juli 2010)650 × 397 (21 kB)SeL mediatime axis reversed
00:51, 18 decembar 2005Minijatura verzije (00:51, 18 decembar 2005)650 × 397 (25 kB)Saperaud~commonswiki*'''Description:''' [[en:Image:{{subst:PAGENAME}}]]

Sljedeća stranica koristi ovu datoteku:

Globalna upotreba datoteke

Ovu datoteku upotrebljavaju i sljedeći projekti:

Potpunija globalna upotreba datoteke